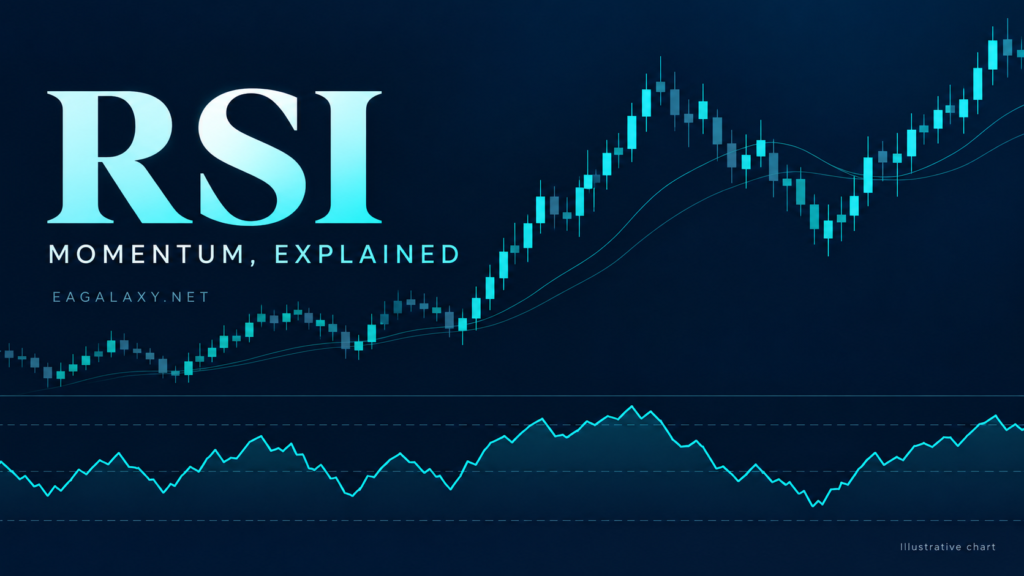
The RSI indicator summarises recent upward and downward price changes on a bounded scale. Its familiar lines at 70 and 30 can be useful reference points, but treating every crossing as a trade instruction confuses a measurement with a complete decision rule. These five lessons explain the distinction through an original calculation and a structured practice exercise.
1. Know what the RSI indicator describes
The Relative Strength Index is a momentum oscillator associated with J. Welles Wilder. It ranges from 0 to 100. Traditional interpretation calls readings above 70 overbought and below 30 oversold; strong trends can keep it in those areas for an extended time. Fidelity’s RSI guide explains these conventions and the standard formula.
In that formula, relative strength compares smoothed average upward change with smoothed average downward change. It does not compare one company with another, and it does not establish whether an asset is fundamentally cheap or expensive. Treat the word “strength” as part of a specific calculation.
2. Work through an RSI indicator calculation
For a simplified arithmetic exercise, suppose the average upward change is 1.20 and the average downward change is 0.80. Their ratio is 1.5. Substituting into RSI = 100 − 100 ÷ (1 + ratio) gives 60. If the two averages are equal and positive, the ratio is 1 and the result is 50.
| Average gain | Average loss | Ratio | RSI |
|---|---|---|---|
| 1.20 | 0.80 | 1.50 | 60 |
| 1.00 | 1.00 | 1.00 | 50 |
| 0.50 | 1.50 | 0.33 approximately | 25 |
These are invented input averages, not reconstructed platform readings. A real implementation also needs a lookback, smoothing and initialisation convention. When checking an RSI indicator on two charts, align those settings and compare the same completed candle.
3. Ask a better question about 70 and 30
Instead of asking “must price reverse at 70?”, ask “what happens after this event under a predefined rule?” Design two separate observations: the first close above 70, and the first subsequent close back below 70. They are different events and can occur many bars apart.
Suppose a fictional sequence is 68, 72, 76, 74 and 69. The first event occurs at 72; the second occurs at 69. A rule tested using the second event cannot claim an entry at the first event. This small distinction prevents a common hindsight error when attractive reversals are highlighted after the outcome is already known.
4. Describe divergence without predicting the ending
Imagine price makes highs at 100 and 103, while RSI readings at those selected highs are 74 and 68. The price and oscillator observations disagree. That disagreement can be labelled bearish divergence under a chosen swing convention, but the sequence alone does not say when price will turn or how far it will move.
Before using the RSI indicator to mark divergence, define a swing. Does a high need two lower highs on each side? Must the oscillator comparison use the same candle or the highest oscillator value within a window? Each choice changes the study. Record when the swing became identifiable so you do not use future candles as if they were available earlier.
Our Price Action and SMC guide provides a related framework for separating observable chart events from explanations about who caused them.
5. Build an RSI indicator review sheet
Use one instrument and timeframe for an initial paper exercise. For every qualifying event, store a screenshot, the reading, the close time and the context you recorded beforehand. Include cases where nothing interesting followed. A repeatable dataset is more useful than a folder of selected winning screenshots.
- State whether the rule uses closed candles.
- Keep the indicator settings fixed during evaluation.
- Define the exit or observation horizon before reviewing outcomes.
- Include spread, commissions and realistic execution assumptions if simulating trades.
- Evaluate later data separately from the data used to design the rule.
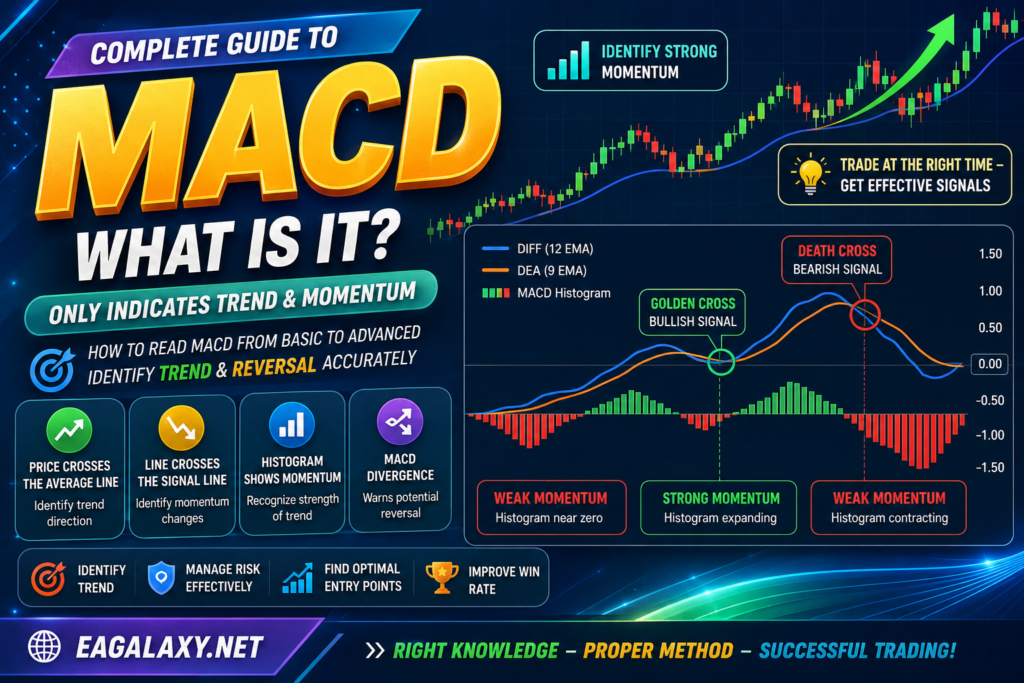
If you add another indicator, state the extra job it performs. For example, compare an RSI event with and without a separately defined MACD momentum filter. Two calculations based on the same prices are not automatically independent confirmation. More filters can also leave a smaller and less representative sample.
Frequently asked questions
Does overbought mean I should sell?
No. It is a conventional description of an oscillator reading, not a complete order instruction. A decision rule also needs context, invalidation and execution assumptions.
Can an RSI indicator be automated?
Numerical conditions can be coded, but the exact crossing, candle timing and exit rules must be explicit. Test the implementation on a demo environment before considering real-money use.
Find related educational tools in the Indicator library.
Educational notice: Examples are synthetic and do not demonstrate profitable performance. This material is not personalised investment advice. Trading leveraged products can cause substantial losses.
- RSI Indicator: 5 Clear Lessons for Beginners
- How to Get Rebate Exness Cashback 100% – Complete Step-by-Step Guide
- Alpha Scalper Pro EA MT5 FREE – High-Frequency Forex Scalping with Smart Risk Control
- Gem Forex Diamond EA for MT5 Robot
- Gemini AI Trading Bot FREE: MetaTrader 5 EA powered by Google Gemini API