
How to Use MACD Effectively — From Basics to Advanced
Learn how to read MACD trend, momentum, crossovers, histogram behavior and divergence, then combine them into practical trading setups with proper confirmation and risk management.

What Is MACD?
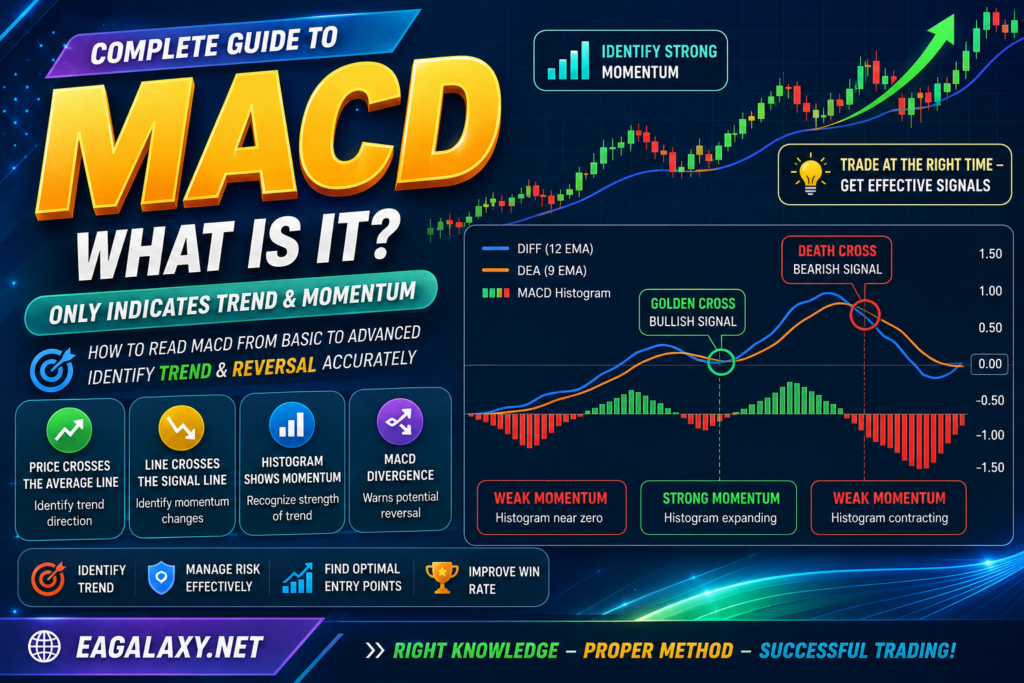
MACD stands for Moving Average Convergence Divergence. It is a trend-following momentum indicator that compares two exponential moving averages to help traders evaluate market direction and momentum strength.
Instead of using MACD as a simple buy/sell crossover tool, use it to answer four practical questions: Is the market bullish or bearish? Is momentum strengthening or fading? Is the current move accelerating? Is there evidence that the trend may be losing strength?
The 3 Main Components of MACD
DIFF / MACD Line
The faster line and the primary measure of the relationship between the two EMAs.
DEA / Signal Line
A smoothed reference line used for crossover and momentum analysis.
Histogram
Visualizes the distance between DIFF and DEA and shows momentum expansion or contraction.
Reading MACD Around the Zero Line
Bullish Context
- Short-term momentum is stronger than the longer-term baseline.
- The market is more likely to be in bullish territory.
- Buy setups deserve more attention when price structure confirms.
Bearish Context
- Short-term momentum is weaker than the longer-term baseline.
- The market is more likely to be in bearish territory.
- Sell setups deserve more attention when price structure confirms.
Golden Cross and Death Cross
Golden Cross — DIFF crosses above DEA
A bullish crossover indicates improving upward momentum. The signal is more meaningful when it occurs in line with the higher-timeframe trend, near an important support zone, or after a valid breakout.
Death Cross — DIFF crosses below DEA
A bearish crossover suggests that bullish momentum is weakening or downside pressure is strengthening. It becomes stronger when price structure confirms the bearish move.
How to Read the MACD Histogram
The histogram shows whether the distance between DIFF and DEA is expanding or contracting, making momentum changes easier to see.
| Histogram Behavior | Meaning | What to Watch |
|---|---|---|
| Bars expand above zero | Bullish momentum strengthens | Trend continuation or breakout follow-through |
| Bars shrink above zero | Bullish momentum fades | Pullback or reversal risk |
| Bars expand below zero | Bearish momentum strengthens | Continuation lower or support break |
| Bars shrink below zero | Bearish momentum fades | Potential bottoming or rebound |
MACD Divergence
Bearish Divergence
Price makes a higher high while MACD makes a lower high. The move may still rise, but its internal momentum is weakening.
Bullish Divergence
Price makes a lower low while MACD makes a higher low. Selling pressure may be weakening even though price briefly pushes lower.
7 Practical MACD Strategies
Identify the dominant direction on H4 or D1, then use MACD on a lower timeframe to time entries in the same direction.
Focus on bullish signals when price trades above the chosen EMA and bearish signals when it trades below.
Use expanding participation to validate whether a breakout or crossover has genuine market support.
Watch MACD crossing the zero line together with a breakout of market structure or consolidation.
In a strong trend, wait for MACD to return toward zero and then expand again in the original trend direction.
Combine MACD direction with RSI recovery from overbought or oversold areas for additional confluence.
Use MACD divergence with engulfing candles, pin bars, support/resistance or a valid structure break.
When MACD Works Best
Better Conditions
- Clear directional trend
- Healthy volatility
- Expanding momentum
- Breakout or pullback structure
- Confirmation from price action or volume
Weaker Conditions
- Narrow sideways ranges
- Repeated whipsaws around zero
- Very low volatility
- Conflicting higher-timeframe direction
- Entries directly into major support/resistance
Common MACD Mistakes
1. Trading every crossover
A crossover without context is weak. A bullish cross inside a strong higher-timeframe downtrend may only represent a temporary correction.
2. Ignoring market conditions
MACD is primarily a trend-following momentum indicator. It can generate many false signals during flat, low-volatility ranges.
3. Ignoring histogram contraction
The histogram can show momentum deterioration before a line crossover, giving an early warning that the current move is losing strength.
4. Neglecting risk management
No indicator eliminates uncertainty. Position sizing, stop-loss placement, maximum risk per trade and drawdown limits remain essential.
Quick MACD Summary
- MACD combines trend and momentum analysis.
- DIFF above DEA suggests bullish momentum; DIFF below DEA suggests bearish momentum.
- The histogram shows whether momentum is expanding or fading.
- Divergence may warn that a trend is weakening.
- MACD generally performs better in directional markets than in narrow ranges.
- Use higher-timeframe direction and price structure as filters.
- Combine MACD with EMA, RSI, volume or price action for stronger confluence.
- Use MACD as confirmation, not as an automatic trade trigger.
Trade with a System, Not Emotion
Explore more trading knowledge, EA strategies and automation resources at EAGALAXY.NET.
- Private EA V1: Pure Mathematical Discipline for Automated Gold and BTC Trading
- Black Wolf Robot MT4 & MT5 – Advanced Automated Trading EA FREE
- What Is MACD? A Complete Guide to Using the MACD Indicator Effectively
- Gemini AI Trading Bot FREE: MetaTrader 5 EA powered by Google Gemini API
- Gann EAGALAXY EA Free