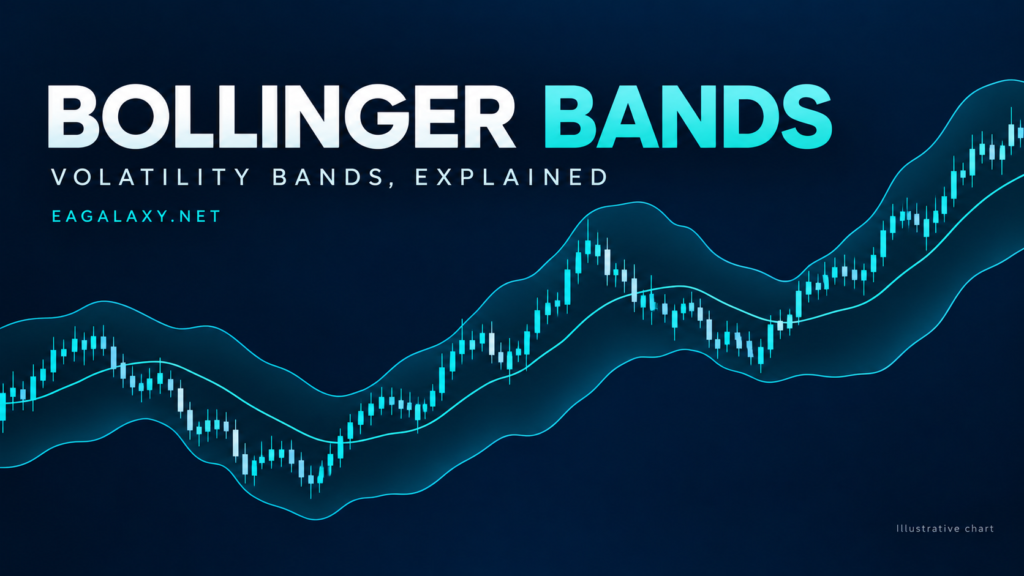
Bollinger Bands place a moving reference envelope around price. They can help describe how price sits relative to its recent average and variability, but an envelope is not a price boundary that must hold. These five practical ideas focus on calculations, careful event definitions and an original worksheet you can use to study a chart.
1. Understand the Bollinger Bands construction
A common setup uses a 20-period simple moving average with an upper and lower band two standard deviations away. The bands respond as the recent sample changes. Settings can be adjusted, so document the length, deviation multiplier and applied price. Fidelity’s Bollinger Bands guide describes the conventional construction and explains that price can remain near a band during a strong trend.
Interpret the envelope as a calculation tied to its inputs. Changing the timeframe changes the observations. Changing from closing prices to another applied price can also alter the result. A chart template should make these choices visible rather than hiding them behind a preset name.
2. Calculate a simple Bollinger Bands snapshot
Suppose a fictional sample has a moving average of 100 and a standard deviation of 2. With a multiplier of 2, the upper band is 104 and the lower band is 96. The envelope width is 8. Relative to the middle value, that width is 8%.
| Component | Illustrative calculation | Result |
|---|---|---|
| Middle band | Given sample average | 100 |
| Upper band | 100 + 2 × 2 | 104 |
| Lower band | 100 − 2 × 2 | 96 |
| Relative width | (104 − 96) ÷ 100 | 8% |
If the average stays at 100 while the deviation falls to 0.75, the bands become 101.50 and 98.50. Width falls to 3%. This invented comparison shows why a narrowing envelope can describe quieter recent prices without supplying the direction of the next move.
3. Define a squeeze before reviewing the breakout
“The bands look tight” is hard to reproduce. For a paper study, define tightness relative to a fixed reference sample, then document the chosen threshold. Use one definition during evaluation rather than moving the threshold until a historical breakout looks impressive.
Define the next event separately. A close outside an envelope and a wick outside it are not the same thing. Write down whether the comparison uses the current completed band value or the previous completed value. Because Bollinger Bands change as new prices arrive, those choices can produce different event times.
A study should include failed expansions and uneventful squeezes. If you select only examples followed by a large move, the selection process already contains information about the answer you are trying to test.
4. Keep continuation and reversal hypotheses separate
Consider two fictional observations. In the first, three consecutive closes occur near the upper band while the middle band rises. In the second, price briefly trades above the upper band and the next close returns inside. They describe different sequences. Neither observation, by itself, defines an entry, stop or target.
Maintain a separate journal label for each hypothesis. A continuation study might investigate follow-through after a specified close outside the band. A reversal study might investigate what follows a specified return inside. Do not switch between the two explanations only after seeing which one would have worked.
You can combine this approach with our Price Action and SMC framework: first describe the event, then define the failure case and the evidence to record. A convincing narrative is easier to create than a rule that survives consistent testing.
5. Review Bollinger Bands with a practical worksheet
For each observation, record the applied price, settings, timeframe, band width and closing price. Add the reason the observation qualified under your rule. Keep the record before advancing a replay chart so that later candles cannot influence the description.
- Use the same event definition across the sample.
- Record both successful and unsuccessful examples.
- Separate rule development from later evaluation.
- Include trading costs if a study becomes a simulated strategy.
- Compare average outcomes and drawdown rather than presenting only win rate.
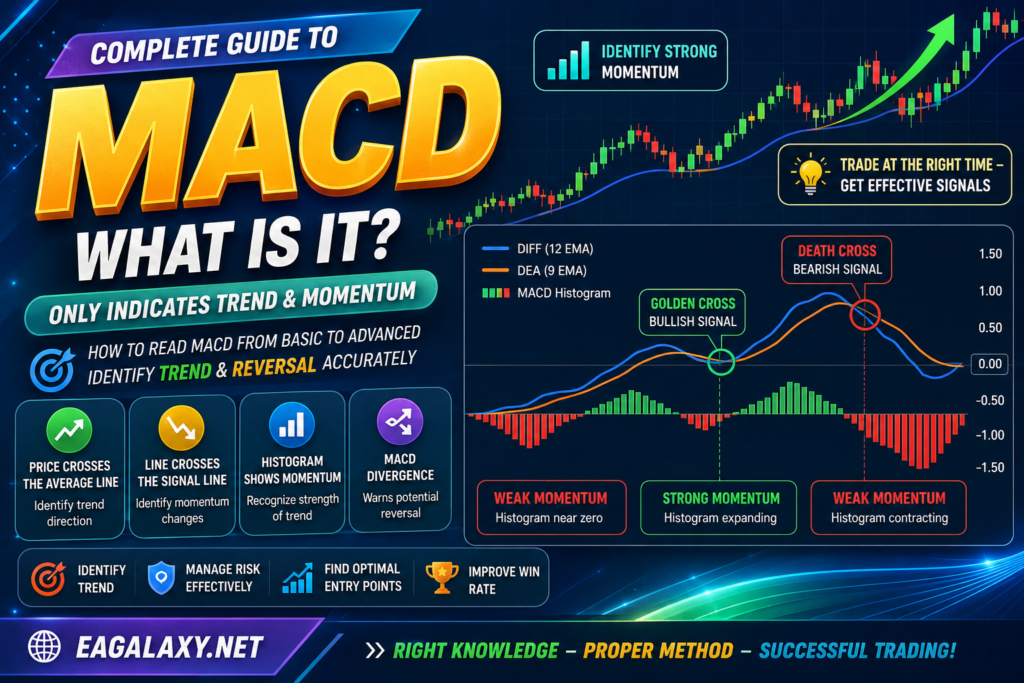
If you add a momentum measurement, give it one clear job. Our MACD guide introduces a different way to describe recent price behaviour. Test whether the additional condition improves the study rather than assuming that more indicators always provide stronger evidence.
Frequently asked questions
Does touching a band guarantee a reversal?
No. A band is a moving statistical envelope, not a hard ceiling or floor. A complete hypothesis needs a defined event and failure condition.
Does a squeeze tell me which direction to trade?
No. Narrowing bands describe recent variability. Direction and execution need separate rules, and any breakout hypothesis can fail.
Are Bollinger Bands a complete trading system?
No. Settings do not specify account risk, execution, exits or how to handle unusual market conditions. Those choices require their own evaluation.
Continue exploring the Indicator library. All calculations here use synthetic inputs.
Educational notice: This material is not personalised investment advice or a live signal. Indicators do not guarantee profitable trades, and leveraged products can cause substantial losses.
- Black Scorpion EA MT4 – High-Precision Breakout Robot for Forex FREE
- Price Action and SMC: 6 Key Concepts Made Easy
- Black Dragon Robot MT5 – Advanced Forex Trading EA with Smart Risk Control FREE
- What Is MACD? A Complete Guide to Using the MACD Indicator Effectively
- Gem Forex Diamond EA for MT5 Robot