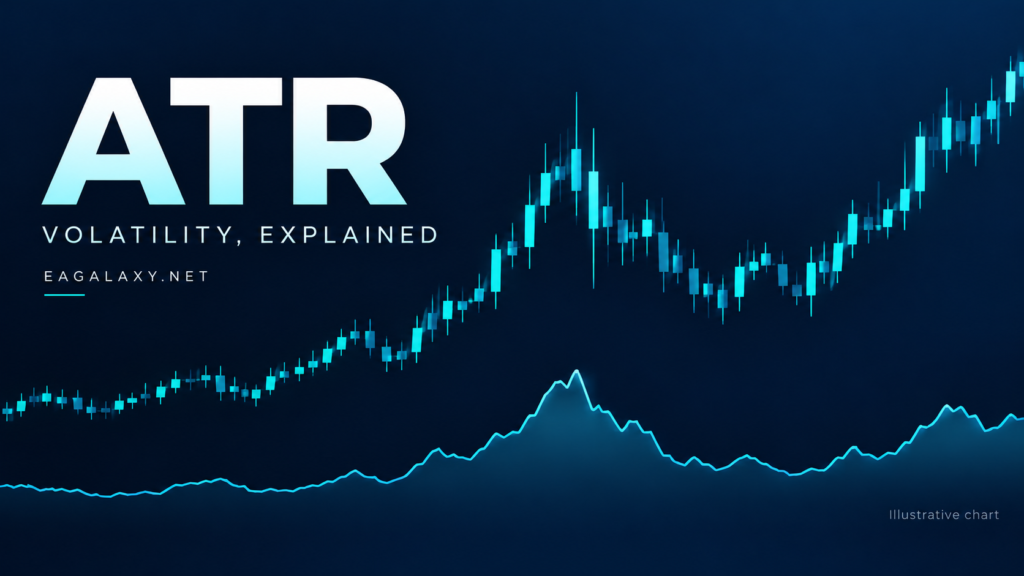
The ATR indicator helps answer a practical chart-reading question: how large have recent price movements been? It does not answer whether the next candle will rise or fall. This guide combines a short definition with an original worksheet, a synthetic risk example and five lessons for using volatility measurements consistently.
1. Understand what the ATR indicator measures
Average True Range smooths a sequence of true ranges. Each true range is the largest of the current high minus low, the absolute difference between the high and previous close, and the absolute difference between the low and previous close. Including the previous close allows gaps to affect the measurement. A 14-period length is common, but the smoothing method and timeframe matter. TradingView’s ATR documentation describes the calculation and its platform settings.
The number is expressed in price units. Before applying it to a trading platform, distinguish a price unit from a point, pip or tick. Those terms depend on the instrument’s quotation and contract specifications.
2. Calculate one bar before trusting a label
Consider a fictional instrument whose previous close is 100. The next candle has a high of 104 and a low of 101. The high-low distance is 3, the high-to-previous-close distance is 4, and the low-to-previous-close distance is 1. True range is therefore 4, not 3. The gap above the previous close explains the difference.
| Candidate | Calculation | Result |
|---|---|---|
| High minus low | 104 − 101 | 3 |
| High versus previous close | |104 − 100| | 4 |
| Low versus previous close | |101 − 100| | 1 |
This is one true-range observation, not a complete ATR value. To reproduce an ATR indicator output, you also need the lookback length, smoothing and starting convention. Record all three when comparing platforms; a small difference does not automatically mean either platform is wrong.
3. Separate a distance from a risk budget
Suppose a paper-trading study records ATR at 2.00. A hypothetical rule uses twice that value as a distance, giving 4.00 price units. With a fictional contract worth $1 per price unit per unit held and a $20 paper risk budget, the arithmetic is $20 ÷ 4.00 = 5 units before costs. If the distance doubles while the budget stays fixed, the arithmetic quantity halves.
This demonstrates sizing arithmetic, not a recommended stop multiplier. An ATR-derived distance still needs to be evaluated against market structure, execution costs and contract rules. A stop does not guarantee an exact realised loss, especially when prices gap. Do not copy the five-unit example into an MT4 or MT5 lot field.
4. Compare like with like
Build a small volatility worksheet for one instrument. At the same observation time each session, record the timeframe, ATR reading and whether the latest candle has closed. Add a note for unusual gaps or announcements. Keep the observation schedule fixed so that the comparison has a clear meaning.
For a simple normalised comparison, ATR of 2 at a price of 100 corresponds to 2%; ATR of 2 at a price of 200 corresponds to 1%. State the denominator and observation time when reporting this ratio. It is a descriptive calculation, not a forecast of tomorrow’s percentage movement.
When combining the ATR indicator with our Price Action and SMC framework, keep the tasks distinct: chart structure describes a scenario, while ATR supplies a recent range measurement. Agreement does not remove uncertainty.
5. Test the ATR indicator as a measurement rule
Design a paper study before optimising settings. For example, compare a fixed-distance rule with one explicitly defined ATR-distance rule over the same observations. Keep entry conditions, exits and costs unchanged. Reserve later observations to evaluate the chosen settings rather than continually adjusting them to fit the past.
- Record the exact indicator version and smoothing.
- Use closed-candle readings if that is what your rule specifies.
- Include rejected and losing examples.
- Check sensitivity to neighbouring settings.
- Compare drawdown and average loss alongside any win rate.
An ATR indicator study becomes useful when another person can reproduce its inputs and arithmetic. A colourful line or a favourable screenshot is not evidence of a durable trading edge.
Frequently asked questions
Does rising ATR mean price will rise?
No. A range measurement has no bullish or bearish sign. Large downward candles can increase it as well.
Is ATR 14 the best setting?
There is no universal best setting. Choose a research question first, then compare a small set of settings without selecting only the best historical result.
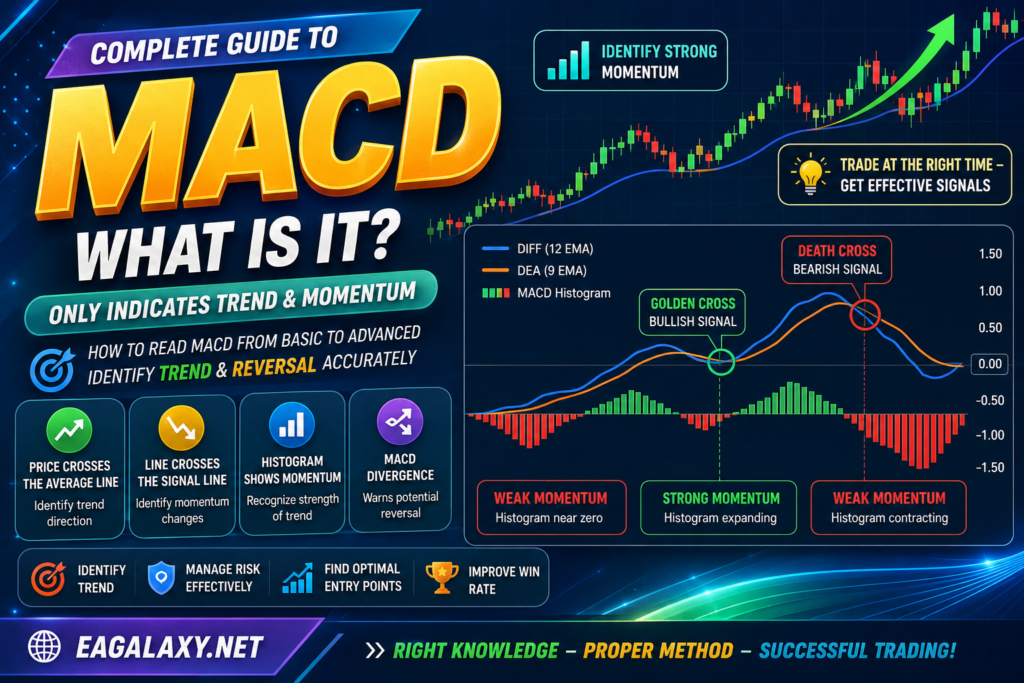
Explore more tools in the Indicator library and compare volatility with momentum in our MACD guide.
Educational notice: All prices and contract values above are fictional. This is not personalised investment advice or a live trading signal. Leveraged trading can result in substantial losses.
- Gem Forex Scalper EA MT5 – Complete Guide and Settings FREE
- Algo Samurai EA – Fully Automated Forex Robot for MT4 MT5 FREE
- Auto SLTP EA MT5 Free | Sync Stop Loss & Take Profit Automatically
- Dragonfly EA MT5 – Smart & Safe Automated Forex Trading Robot FREE
- Close All Fast – Profit & Loss Manager (MT5)