
Price Action and SMC give traders a vocabulary for describing what a chart is doing. The useful starting point is a repeatable observation process: identify the market context, define a testable scenario and decide what would invalidate it. This beginner’s guide separates chart patterns from claims about the traders behind them, then walks through a synthetic example you can reproduce in a trading journal.
Educational guide · Original illustrations · No live trade signals
Price Action and SMC: the essential vocabulary
SMC stands for Smart Money Concepts. Discussions of SMC and ICT commonly use the terms below. Different educators may define them differently, so write down the convention you use before testing a setup.
- Market structure: the sequence of swing highs and lows.
- BOS: a break of a relevant swing in the existing trend’s direction.
- CHoCH: an initial break against that structure; a possible change, not a confirmed reversal.
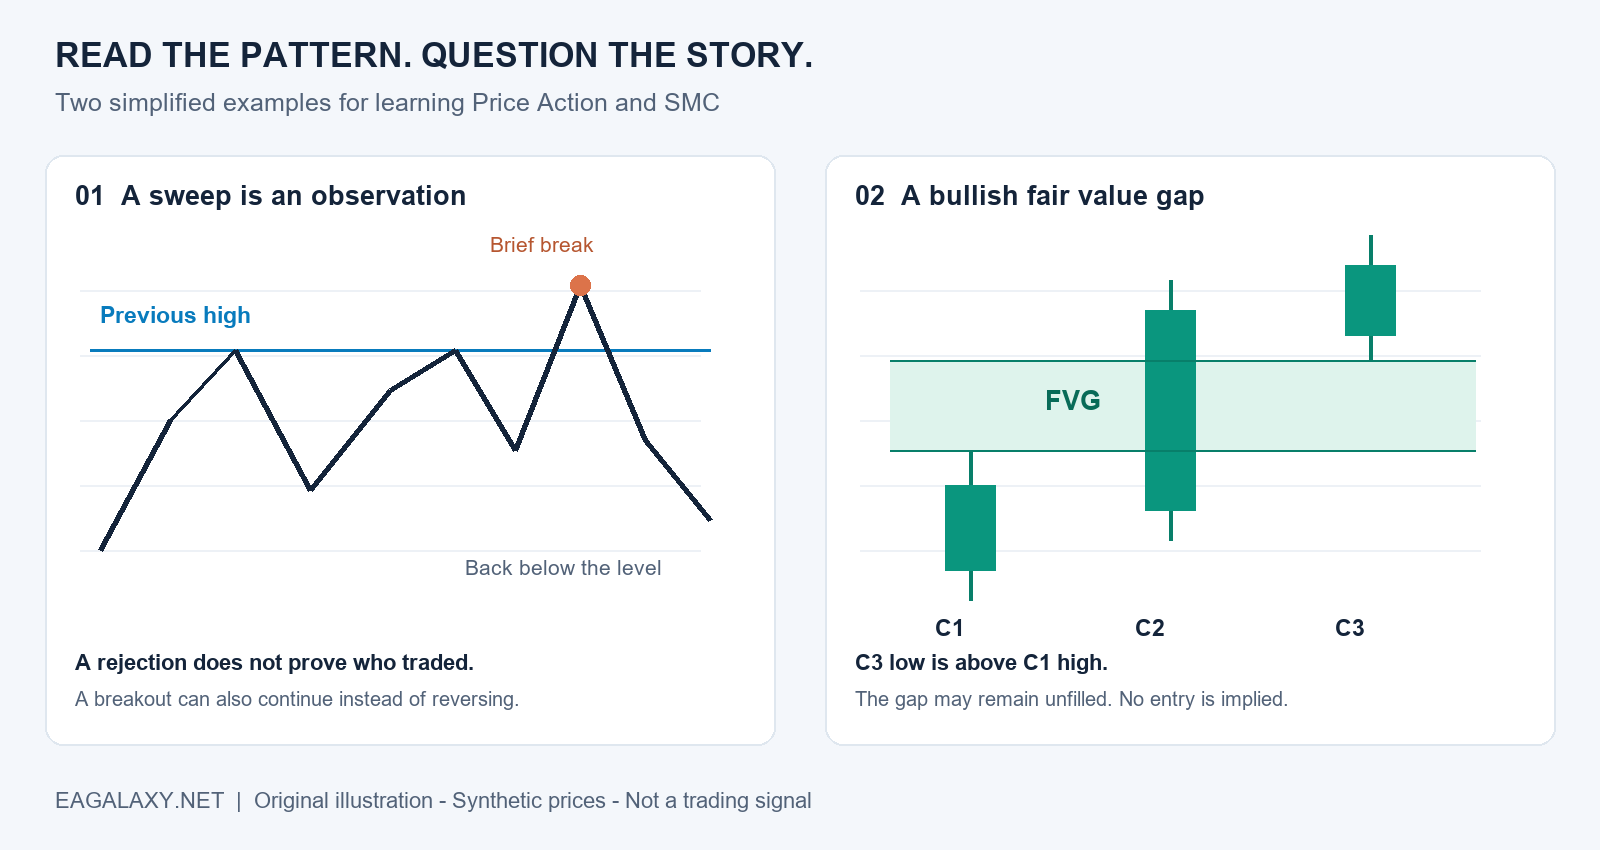
- Liquidity sweep: a brief move beyond a visible high or low followed by a return.
- Order block: a zone some SMC traders mark around candles preceding a strong move.
- Fair value gap (FVG): a three-candle non-overlap between the first and third candles’ wicks.
For the broader terminology that prompted this guide, see DUYNENFX’s introduction to Price Action, ICT and SMC. This article uses its own examples and learning framework rather than reproducing that article.
What the chart shows—and what it cannot establish
A chart can show that price traded above yesterday’s high and then returned below it. That observation is different from saying a particular institution deliberately hunted stops. A candlestick does not identify who placed every order or reveal their intention. Treat institutional explanations as hypotheses, not facts established by the pattern alone.
Likewise, an FVG is a geometric chart condition. Its name does not make the shaded area an objective measure of fair value, and price need not revisit it. A useful annotation describes an event precisely enough that another person could mark the same event without seeing the eventual outcome.
How to study Price Action and SMC in three passes
1. Describe the context before selecting a pattern
Choose one instrument and a fixed chart timeframe. Mark only the most recent meaningful swings and the boundaries of any visible range. Write a sentence such as “price is inside the previous session’s range” before considering an entry. If two reasonable swing selections give opposite interpretations, record the ambiguity instead of forcing a directional label.
Previous highs and lows can serve as reference zones for support and resistance. They are not exact barriers that must hold. CME Group’s support and resistance lesson explains this zone-based approach and how a broken level can change its role.
2. Define an event you can recognise in real time
Replace “wait for smart money” with a measurable rule. For a paper study, you might record a move above a marked high only after a candle closes back below that high. Specify whether your rule uses a wick or a closing price, and which swing qualifies. Do not change that definition after reviewing the outcome.
3. Write the failure case first
For each scenario, describe the price behaviour that would contradict it. A rejection hypothesis might fail if price holds above the former range boundary rather than returning inside. A study can also include a time limit: if the expected follow-through has not appeared within a predefined number of bars, record “no follow-through.” This makes inactivity an observable result rather than a reason to invent another setup.
Price Action and SMC: a worked example with synthetic prices
Imagine a fictional instrument with two recent highs near 100.00. It trades to 100.40, then a candle closes at 99.80. A later candle trades below a previously marked local low at 99.50. These are observations. They do not establish the identity of the buyers and sellers or guarantee a move lower.
| Journal field | Illustrative entry |
|---|---|
| Context | A visible range, with a reference high at 100.00 |
| Event | Trade above the high, then close back below |
| Hypothesis | The attempted breakout may have failed |
| Alternative | Price could reclaim 100.00 and continue higher |
| Evidence to record | The following candles, spread and any scheduled announcement |
To practise risk arithmetic separately, suppose a paper entry is 99.60, a hypothetical stop is 100.50 and a hypothetical target is 97.80. The stop distance is 0.90 and the target distance is 1.80, giving a planned reward-to-risk ratio of 2:1 before costs. That ratio describes the plan; it says nothing about the probability of reaching the target.
With a purely illustrative risk budget of $10 and a contract that changes by $1 per price unit per unit held, $10 ÷ 0.90 gives approximately 11.11 units before rounding and costs. Real instruments have different tick values, contract sizes and minimum volume steps. Verify those specifications rather than treating this arithmetic as an MT4 or MT5 lot recommendation. Slippage can also make a realised loss exceed the planned stop distance.
Where indicators fit into the process
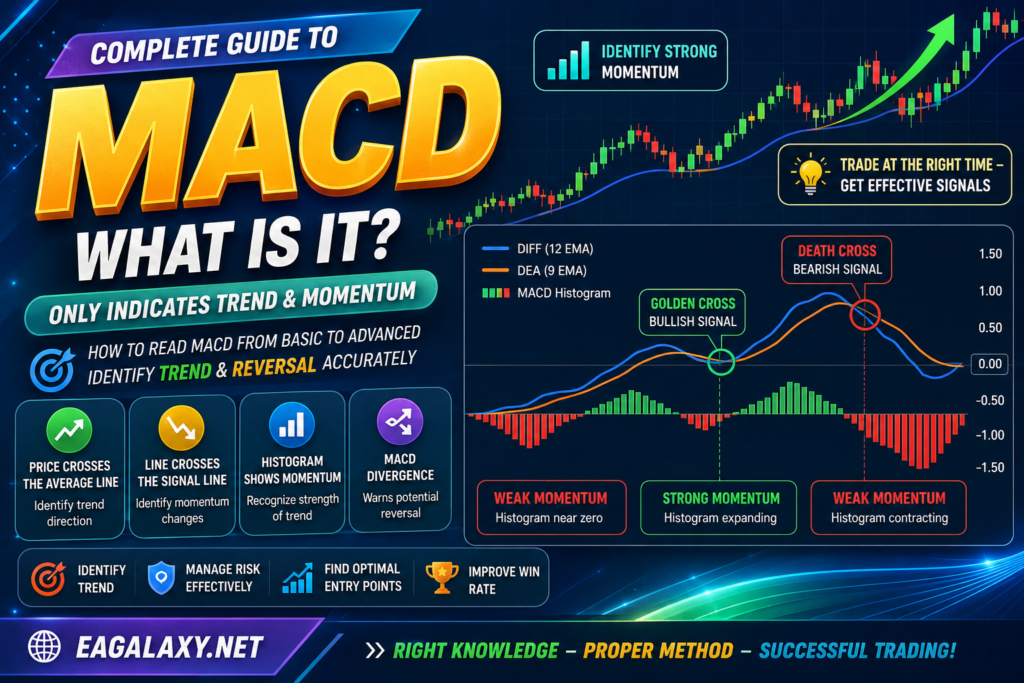
In a Price Action and SMC workflow, an indicator can add a consistent measurement to a discretionary chart description. For example, you could record MACD direction alongside each setup without allowing it to redefine the setup after the fact. Compare the same rules with and without that filter. More agreement between indicators does not automatically mean more independent evidence, especially when they all transform the same price series.
Continue with our MACD guide, or explore the Indicator library. Choose tools for a specific measurement task, not because their chart labels look convincing.
A beginner’s testing checklist
Use this checklist whenever you review a Price Action and SMC setup. Save the rules beside your chart so that a similar pattern receives the same treatment in the next review.
- Record the rule and chart screenshot before revealing the next candles.
- Keep losing and uneventful examples, not just attractive reversals.
- Include spread, commission and plausible execution costs.
- Separate observations used to design the rule from later observations used to evaluate it.
- Track average win, average loss, drawdown and sample size together.
- Use a demo environment while learning the platform and testing assumptions.
Documenting entry, exit and risk limits is part of a trading plan. See CME Group’s lesson on defining trading strategies for a planning reference. A small or selectively chosen sample cannot establish a dependable edge.
Frequently asked questions
Is SMC an indicator?
No. Price Action and SMC describe approaches to reading charts, rather than a single indicator. Software can draw related labels, but the software’s swing selection, confirmation rules and repainting behaviour still need to be understood.
Must every fair value gap fill?
No. A gap can remain unfilled, and a return to it can continue through the zone. Test a defined rule rather than assuming a guaranteed reaction.
Can an EA automate a Price Action and SMC setup?
Only the parts that have explicit rules can be automated consistently. Define swing detection, candle-close confirmation, exits and position sizing first. Review our Expert Advisor resources with those implementation questions in mind.
Risk notice: This material is educational and is not personalised investment advice. Leveraged trading can cause substantial losses. The examples and illustrations use fictional prices and do not demonstrate profitable performance.
- RSI Indicator: 5 Clear Lessons for Beginners
- Gem Forex Scalper EA MT5 – Complete Guide and Settings FREE
- Hands of God V3.0 EA MT5 – Divine Precision in Algorithmic Trading FREE
- Black Wolf Robot MT4 & MT5 – Advanced Automated Trading EA FREE
- Dragonfly EA MT5 – Smart & Safe Automated Forex Trading Robot FREE